
1-What Is Electrical resistivity tomography (ERT)?
Electrical resistivity tomography (ERT) is a geophysical imaging technique used to study the structure and properties of the subsurface. It involves measuring the subsurface’s resistance to an injected current, which is sent through 60 or 120 180/More electrodes at the surface. Current flows through the ground, and the resulting voltage is measured by 60 or 120 electrodes on the surface. By mapping the distribution of subsurface electrical resistance, ERT can help identify and locate subsurface features such as geological structures, mineral deposits, sinkholes, fractures, groundwater, and contaminants.
2-What are the Feature of ERT?
• Distinguish between fresh water and salt water
• Making a subsurface map to overview the soil types/lithology
• Ideal for gold, copper, lead-zinc, and polymetallic exploration(Add solid non-polarized electrode IP) 2D RES&IP
• Determining caves, voids and sinkholes before drilling and foundation work
• Determining optimal locations for drilling groundwater wells
• Investigating the depth to bedrock
• Monitoring engineered and natural slopes with a high potential for landslides
• Investigating and monitoring pollution plumes
• Determining economically-important mineral deposits
• Delineating archeological sites
• Time lapse Monitoring of subsurface processes such as groundwater recharge, saltwater intrusion, dam leakage, and mining operations
• University Research or Training projects
3-What is the principle of ERT?
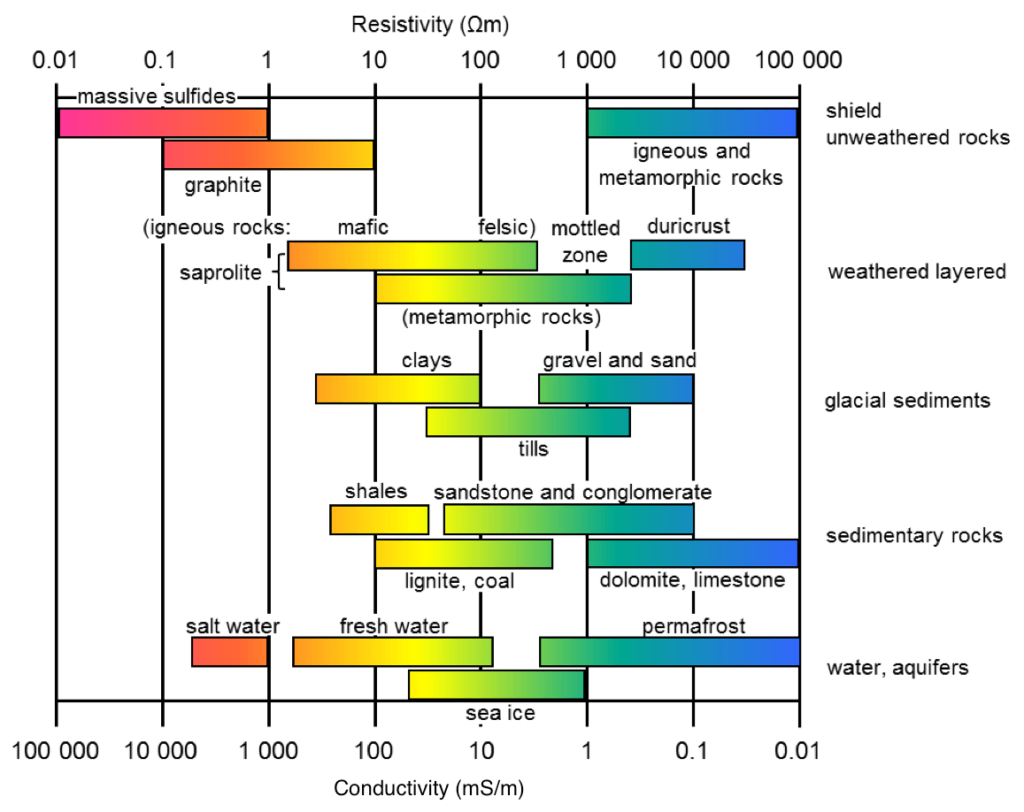
ERT is based on the principle that different materials have different electrical resistivities, which affect the flow of electrical current through the subsurface. For example, rocks and soils with high porosity and high water content typically have low resistivities, while those with low porosity or high mineral content have high resistivities. By measuring the distribution of electrical resistivity in the subsurface, ERT can provide information about the spatial distribution of these materials and their properties,Technology for Measuring Earth or Soil Resistivity Based on the Wenner Method.
- It is based on the assumption that the earth consists of homogeneous layers that are isotopic (properties are the same in all directions).
- The spacing between the electrodes determines the depth that is measured. Larger spacing results in greater depth of penetration.Usually a detection depth of 1/6-1/3 of the cable length
- Apparent resistivity is calculated using the measured potential difference and current along with the electrode spacing. This represents the resistivity of an equivalent homogeneous ground.
- To determine true ground resistivity, measurements are taken with different electrode spacings and analysis is done to determine layering and actual resistivity values.
The main advantages of the Wenner method are its simplicity, sensitivity to vertical changes, and the fast data acquisition. A key limitation is that horizontal structures are poorly resolved. Overall, it is a very useful technique for subsurface surveying and geotechnical investigations.
ERT is a non-invasive and non-destructive technique that can be used in a variety of applications, including mineral exploration, environmental monitoring, civil engineering, and archaeology. The technique can be applied using a variety of electrode arrays and configurations, depending on the specific application and subsurface conditions. ERT data can be processed and interpreted using a range of software programs, such as RES2DINV, to generate 2D or 3D images of the subsurface resistivity distribution.

4-How does ERT obtain true resistivity?
To obtain a cross-sectional model of true ground resistivity, the recorded data are transferred to a computer for processing using RES2DINV software. The data is subjected to a finite-difference inversion process, which involves a series of iterative routines to determine a 2D simulated model of the subsurface. This model is then compared to the observed data and revised to achieve convergence between theoretical and observed data using non-linear least squares optimization. The final RMS error indicates the validity of the true resistivity model.
5-What are the frature of resistivity tomography?
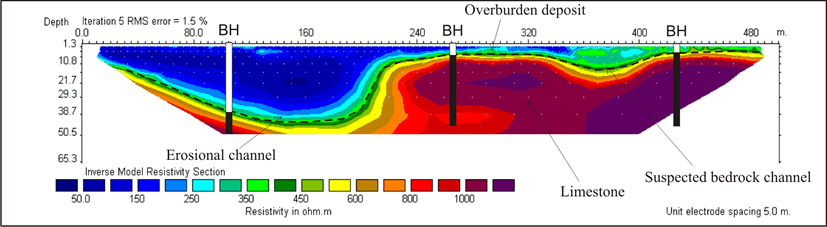
The true resistivity models are presented as colour contour sections that reveal the spatial variation in subsurface resistivity. However, the 2D method of presenting resistivity data has limitations in areas with highly irregular or complex geological features,The resistivity values of geological materials can be used to identify boundaries between distinct lithologies on resistivity cross-sections. However, in some cases, there may be overlaps between the ranges of possible resistivity values for the targeted materials, which necessitates the use of other geophysical surveys and/or drilling to confirm the nature of identified features.
It is important to note that readings can be affected by poor electrical contact at the surface, and an increased electrode array length is required to locate increased depths of interest. Therefore, the site layout must permit long arrays. Additionally, the resolution of target features decreases with increased depth of burial.

As part of a hydrological study, a series of resistivity tomography profile lines were obtained to map variations in the overburden thickness. The section above shows the results of this study, revealing an extensive erosional channel feature as well as more subtle variations in the overburden thickness.

